Skip to content
Building physics and cost-effectiveness

How the coating works — and what it saves

The principle

Live warmer, heat less.
Insulate smarter, not thicker.

PScoat doesn't change your house — it blocks heat transfer at the surface.

In simplified terms, the heat path works like resistors connected in series. The greater the total resistance, the less heat can be transferred at the same temperature difference.

Classic insulation

Rsi RWall ↑more insulation material Rse

The component's resistance is increased by adding extra insulation thickness.

PScoat

Rsi RWall ↑+ conductivity R*se ↑Surface

PScoat changes heat transfer at the external surface — and with it, the heat path.

The difference is immediately clear: classic insulation only increases the component's resistance. PScoat also changes heat transfer through convection and radiation at the external surface.
The physics, explained in more detail
20 °C
Interior Indoor air releases heat to the wall surface.
0 °C
Outdoor air The external surface releases heat to the surroundings.
RsiInside
Wall material
RseOutside
1

Heat transfer inside

Indoor air transfers heat to the wall surface. This transfer has its own thermal resistance, described as Rsi.

2

Heat through the material

Heat then flows through the wall material. Its resistance depends, among other things, on λ and the material thickness.

3

Heat transfer outside

Finally, heat has to pass from the external surface to the outside environment. This portion is described as Rse.

Simplified calculation example 10 cm of concrete – why the surface can be surprisingly relevant to the overall heat path.

① Material alone

First, we look purely at the 10 cm thick concrete layer.

Rconcrete = d / λ = 0.10 / 2.0 = 0.05 m²K/W
U = 1 / R = 1 / 0.05
U = 20 W/(m²K)

This only covers conduction through the material itself. The heat transfers at both surfaces are still missing.

② The complete heat path

Now we also factor in the heat transfers at the internal and external surfaces.

Rtotal = Rsi + Rconcrete + Rse = 0.13 + 0.05 + 0.04 = 0.22 m²K/W
U = 1 / 0.22
U ≈ 4.55 W/(m²K)

In this simplified example, the surface resistances contribute significantly to the total thermal resistance.

Thermally, a wall doesn't end at its surface.

The U-value describes the entire heat path: from the room, across the internal surface, through the component, across the external surface, to the outside environment.

Simplified:

Rtotal = Rsi + Rmaterial + Rse
U = 1 / Rtotal

So why is a fixed Rse value still used?

In standardised U-value calculations, the actual heat transfer conditions can't be fully recalculated for every building, every hour, every wind speed, every surface temperature and every radiation environment.

That's why building physics uses defined reference conditions and standardised surface resistances for the standard calculation.

EN ISO 6946

This standard sets out methods for calculating the thermal resistance and thermal transmittance of building components, using standardised boundary conditions and surface resistances.

The commonly used value Rse = 0.04 m²K/W is therefore a normative reference figure for the standard calculation – not a universal law of nature that stays exactly the same under all real outdoor conditions.

And this is exactly where it gets interesting for surface coatings.

When the thermal properties of an external surface change, it's not just an extra layer of material. The surface's thermal boundary conditions relative to air, radiation and solar radiation can change too.

So the decisive question isn't just: “How thick is the layer?” It's also: “How does the entire heat path change?”

The claim isn't "warmer" — it's "above the mould-risk threshold".

What matters for an existing building isn't comfort, but the temperature of the room-side surface. If it falls below the mould-risk threshold under DIN 4108-2, mould grows — regardless of how well the room is heated. The cross-section shows both cases on the same wall.

Cross-section of a 24 cm solid brick wall showing the temperature profile without and with interior coatingHorizontal cross-section through the wall, left to right: outside air, 15 mm exterior render, 24 cm solid brick masonry, 15 mm interior render, 1 mm coating (shown greatly exaggerated in scale), inside air. The render and masonry layers are drawn to scale relative to each other; only the coating is exaggerated. The vertical axis shows temperature from −5 °C to 21 °C. The dashed curve applies without coating, the solid curve with coating; both curves are also labelled directly and so are not distinguished by colour alone. Without coating, the temperature drops from 21 °C room air to 13.0 °C at the interior surface, which is below the mould criterion of 13.2 °C and only 0.1 K above the dew point of 12.9 °C. With coating, the interior surface temperature is 19.7 °C, 6.5 K above the mould criterion. Both surface temperatures were measured at the property, not in a test rig under standard conditions. The profile within the component is back-calculated from these using R_si = 0.13, R_se = 0.04 and 0.015 m²K/W per render layer, and is not measured at any point; the entire measured difference is thereby mathematically attributed to the coating layer. This means the render surface behind the coating is calculated at −2.1 °C rather than 13.0 °C - condensation within the component cross-section must therefore be assessed separately per DIN 4108-3 and is not addressed by this drawing.−505101520°CMould criterion 13.2 °C · calculated value per standardDIN 4108-2, f_Rsi = 0.7, at −5 °C / 21 °CDew point 12.9 °C · calculated value per standardat 21 °C room air and 60 % RH19,7 °C13,0 °CDanger zone below 13.2 °CSurface below the mould criterionCoating 1 mm · shown exaggeratedOutside airMasonry 24 cmInside airExternal render 15 mmInternal plaster 15 mmwithout coating · 13.0 °Cdashed curve · field measurement, evidence outstandingwith coating · 19.7 °Csolid curve · field measurement, evidence outstandingoutside −5 °C · inside 21 °C · 60 % RH · wall build-up: 24 cm solid brick + 15 mm lime-cement plaster
G1 - Component cross-section with temperature profile. The point is not "warmer", but "out of the mould criterion": without coating, the internal surface at 13.0 °C lies below the mould criterion of 13.2 °C; with coating, at 19.7 °C it lies clearly above it.
Surface temperatures 13.0 °C and 19.7 °C: Field measurement on a multi-family building of reinforced-concrete frame construction. Boundary condition: outside -5 °C / inside 21 °C / 60% RH. Measured at the property, not in a test rig under standard conditions.
Dew point 12.9 °C and mould criterion 13.2 °C: Calculated value per standard - dew point per the Magnus formula for 21 °C and 60% RH, mould criterion per DIN 4108-2 with f_Rsi = 0.70 at -5 °C outside and 21 °C inside.
All other temperatures within the component (−2.5 / −1.6 / 12.1 °C without, −4.6 / −4.5 / −2.2 / −2.1 °C with coating): calculated values, back-calculated from the two measured surface temperatures using R_si = 0.13, R_se = 0.04 and 0.015 m²K/W per plaster layer. No measurements were taken at these points.
The measured difference is attributed entirely to the coating layer - a model assumption, not a material property. This results, by calculation, in a colder plaster surface behind the coating (−2.1 instead of 13.0 °C); interstitial condensation must be assessed separately in accordance with DIN 4108-3 and is not addressed by this drawing.
Scale: the plaster and masonry layers are drawn to scale relative to one another (1.5 units per mm). Only the 1 mm coating thickness is shown exaggerated, so the layer remains visible.
Values as a table
Temperatures in the component cross-section, boundary condition: outside −5 °C · inside 21 °C · 60% RH · wall build-up: 24 cm solid brick + 15 mm lime-cement render
PositionTemperature without coatingTemperature with coatingReference valueBasis
Outside air−5,0 °C−5,0 °Cno limit value (assumed boundary condition)Assumed boundary condition, not a measurement.
Outer surface (exterior render)−2,5 °C−4,6 °Cno limit valueCalculated value – back-calculated from the two measured surface temperatures via the layer resistances. Not measured at this point.
Transition exterior render / masonry−1,6 °C−4,5 °Cno limit valueCalculated value – back-calculated from the two measured surface temperatures via the layer resistances. Not measured at this point.
Transition masonry / interior render12,1 °C−2,2 °Cno limit valueCalculated value – back-calculated from the two measured surface temperatures via the layer resistances. Not measured at this point.
Room-side render surface (beneath the coating)13.0 °C (= interior surface, no coating present)−2,1 °Cno limit value; condensation within the cross-section must be assessed separately per DIN 4108-3Calculated value – a consequence of the model assumption that the entire measured difference is attributed to the coating layer. Not measured at this point.
Interior surface (room side)13,0 °C19,7 °CDew point 12.9 °C / mould criterion 13.2 °CField measurement of the surface temperature at the property. Limit values: calculated per standard.
Inside air21,0 °C21,0 °Cno limit value (assumed boundary condition)Assumed boundary condition, not a measurement.

The working principle: radiation, not thickness

A 1 mm layer cannot build up any meaningful insulating effect through its thickness alone. The effect works via emissivity: a surface that radiates less heat stays warmer. This is the same low-E effect used in a coated insulating glass pane.

Radiation balance: emissivity of standard render and PowerSmartCoat comparedTwo side-by-side half-images, each with a vertical wall edge and a fan of arrows representing heat radiation into the room. On the left, standard render with an emissivity of around 0.90 (literature value): ten thick arrows, radiated output 100 percent as the reference value. On the right, PowerSmartCoat with an emissivity of 0.25: only three thin arrows, radiated output around 28 percent. The number of arrows encodes the magnitude of the radiation. The comparison is made at the same surface temperature; the overall effect on the component also depends on convection and thermal conduction.Standard plasterEmissivity around 0.90Literature value for mineral plaster10 arrowsradiated power, relativecalculated, basis: literature value100 %PowerSmartCoatEmissivity 0.25System data PSC 250 T3 arrowsradiated power, relativecalculated from the emissivitiesaround 28 %Comparison of emissivities at the same surface temperature.The overall effect on the component also depends on convection and thermal conduction.
Figure G2: Radiation balance and emissivity. Method: comparison of radiated power according to Stefan-Boltzmann, where power is proportional to emissivity. Boundary condition: identical surface temperature, identical area, identical surroundings; the relative radiation is 0.25 divided by 0.90, equal to around 28 per cent. The value 0.90 for mineral render is a literature value; the value 0.25 comes from our own system data. What is shown is a low-E effect, i.e. reduced thermal radiation from the surface.
Values as a table
Radiated power at identical surface temperature, relative to standard render equal to 100 per cent.
SurfaceEmissivityrelative radiationBasis
Standard render, mineral-basedaround 0.90100 %Literature value for mineral render
PowerSmartCoat0,25around 28%System data PSC 250 T

Calculation: relative radiation equals emissivity divided by 0.90. The graphic encodes magnitude via the number of arrows, ten versus three, so the difference remains countable even for colour-blind viewers and in black-and-white printouts. Comparison of emissivities at the same surface temperature. The overall effect on the component also depends on convection and thermal conduction.

Low-E layer
virtually invisible low-E coating

There's no polystyrene in your window either.
Just a coating.

That's been standard for 30 years.

Modern thermal glazing uses what are known as low-E coatings.

These ultra-thin, virtually invisible layers change the thermal properties of the glass surface, reducing long-wave thermal radiation exchange in particular.

As a result, the U-value of the entire window improves by around 50% – even though the coating itself is extremely thin.

The key principle: Thermal protection isn't created solely by putting more material between warm and cold. The properties of a surface can also influence how heat is transferred between a component and its surroundings.

Technical background: The U.S. Department of Energy explicitly describes low-E coatings as a measure for reducing the U-factor. U.S. Department of Energy – Low-E and window performance

The experiment

250 °C → 45 °C

A heated stainless steel plate – once uncoated, once coated with PScoat.

Stainless steel plate on a switched-on hotplate · contact measurement

Real building measurement

The effect of a changed surface –
Measured.

The decisive question isn't whether a thin coating could theoretically work. What matters is what's actually measured on the real component.

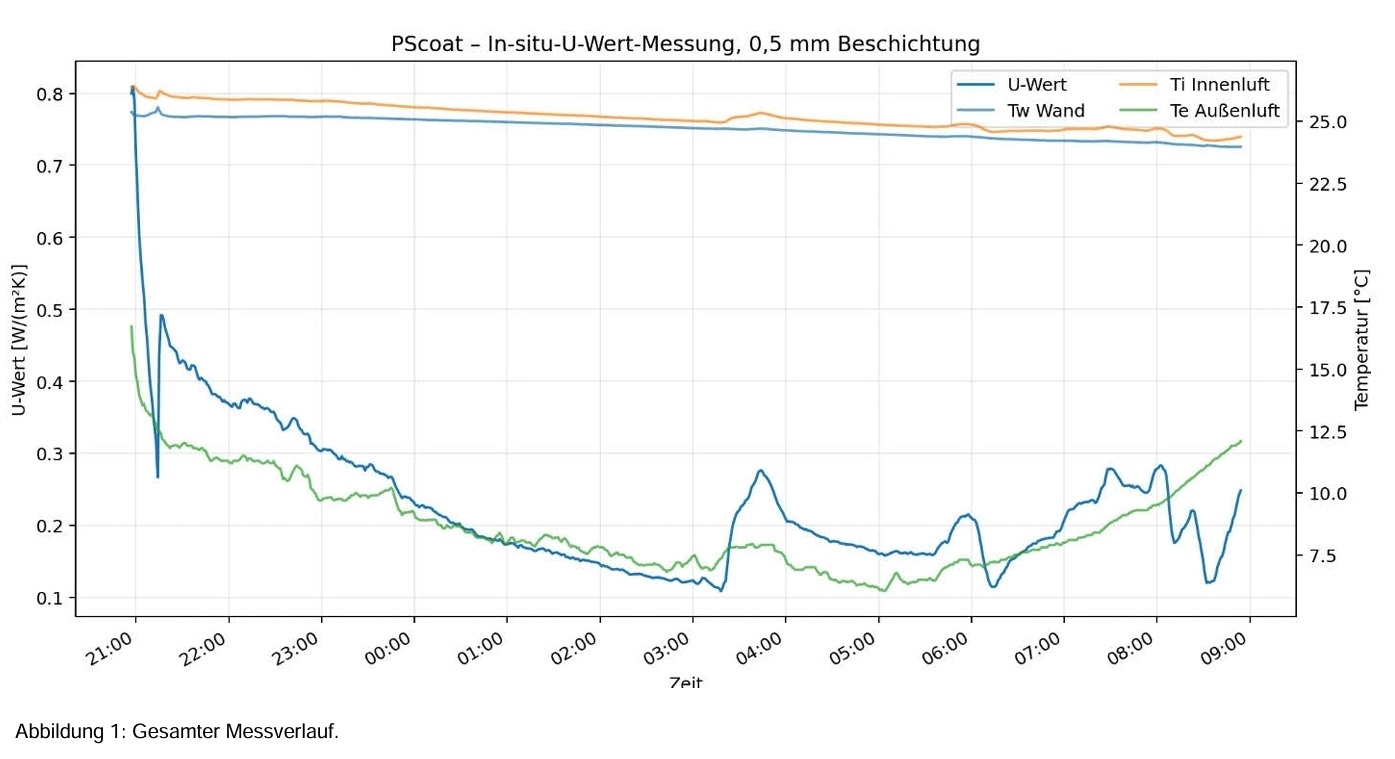
In-situ U-value measurement with just 0.5 mm of PScoat

Measured on the real component over several hours of continuous monitoring – not a single snapshot.

0,5 mmCoating thickness
PScoat – in-situ U-value measurement with 0.5 mm coating: progression of U-value, wall temperature, indoor and outdoor air temperature

Original measurement data: U-value, wall temperature, indoor air temperature and outdoor air temperature over the entire measurement period.

Coating0.5 mmmeasured setup
stable measurement range≈ 0.12–0.18W/(m²K), depending on the time of measurement
Measurement duration≈ 12 hcontinuous measurement run

What does this measurement show?

The U-value was determined on the real component over an extended period. The measurement data shows the calculated U-value settling into a low range for a sustained period after the initial settling phase.

So we're looking not just at a single temperature value, but at the progression of heat transfer over time under real conditions.

PScoat hasn't run measurements like this just once. The effect has been repeatedly examined and reproduced on different buildings and component structures.

The claim is measurable.PScoat isn't explained by a theoretical material figure alone. What matters is the thermal effect on the actual component – and that effect can be measured.
Want to know what this means for your building?Start by calculating which system suits your building.
Calculate my building
Thermal image comparison

Here's what the change looks like in a thermal image.

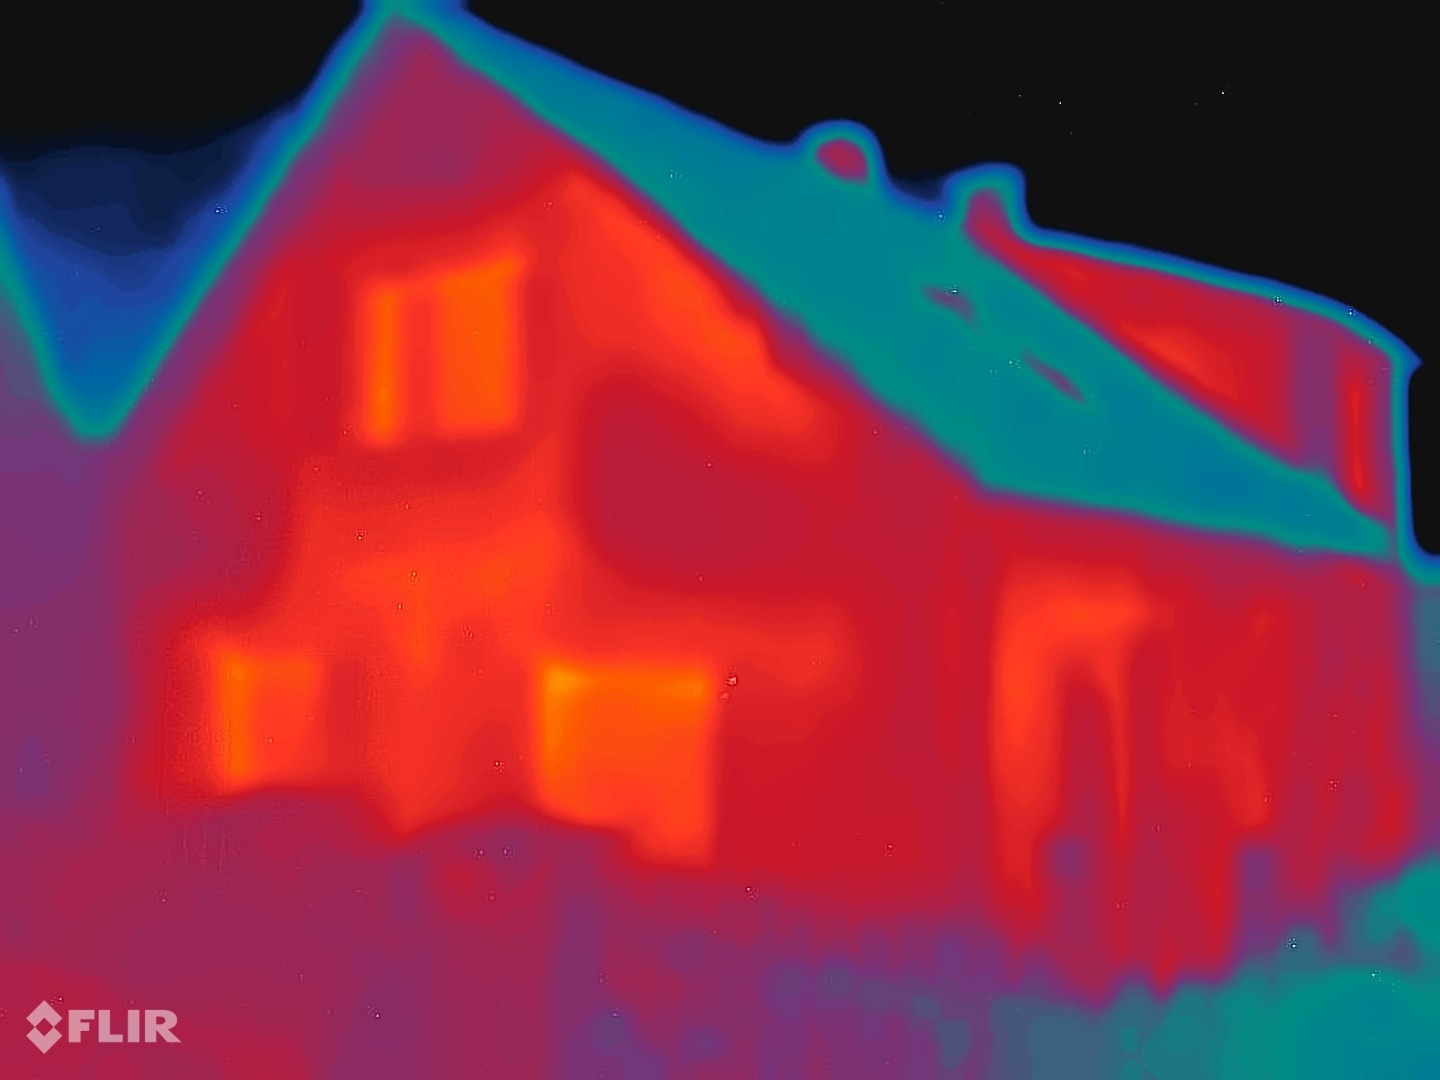
The U-value measured earlier on the real building also shows up in the thermal image of the facade.

Thermal image of the facade before coating
Before

Clearly visible heat loss

The heated building surfaces stand out clearly against the cooler surroundings in the thermal image.

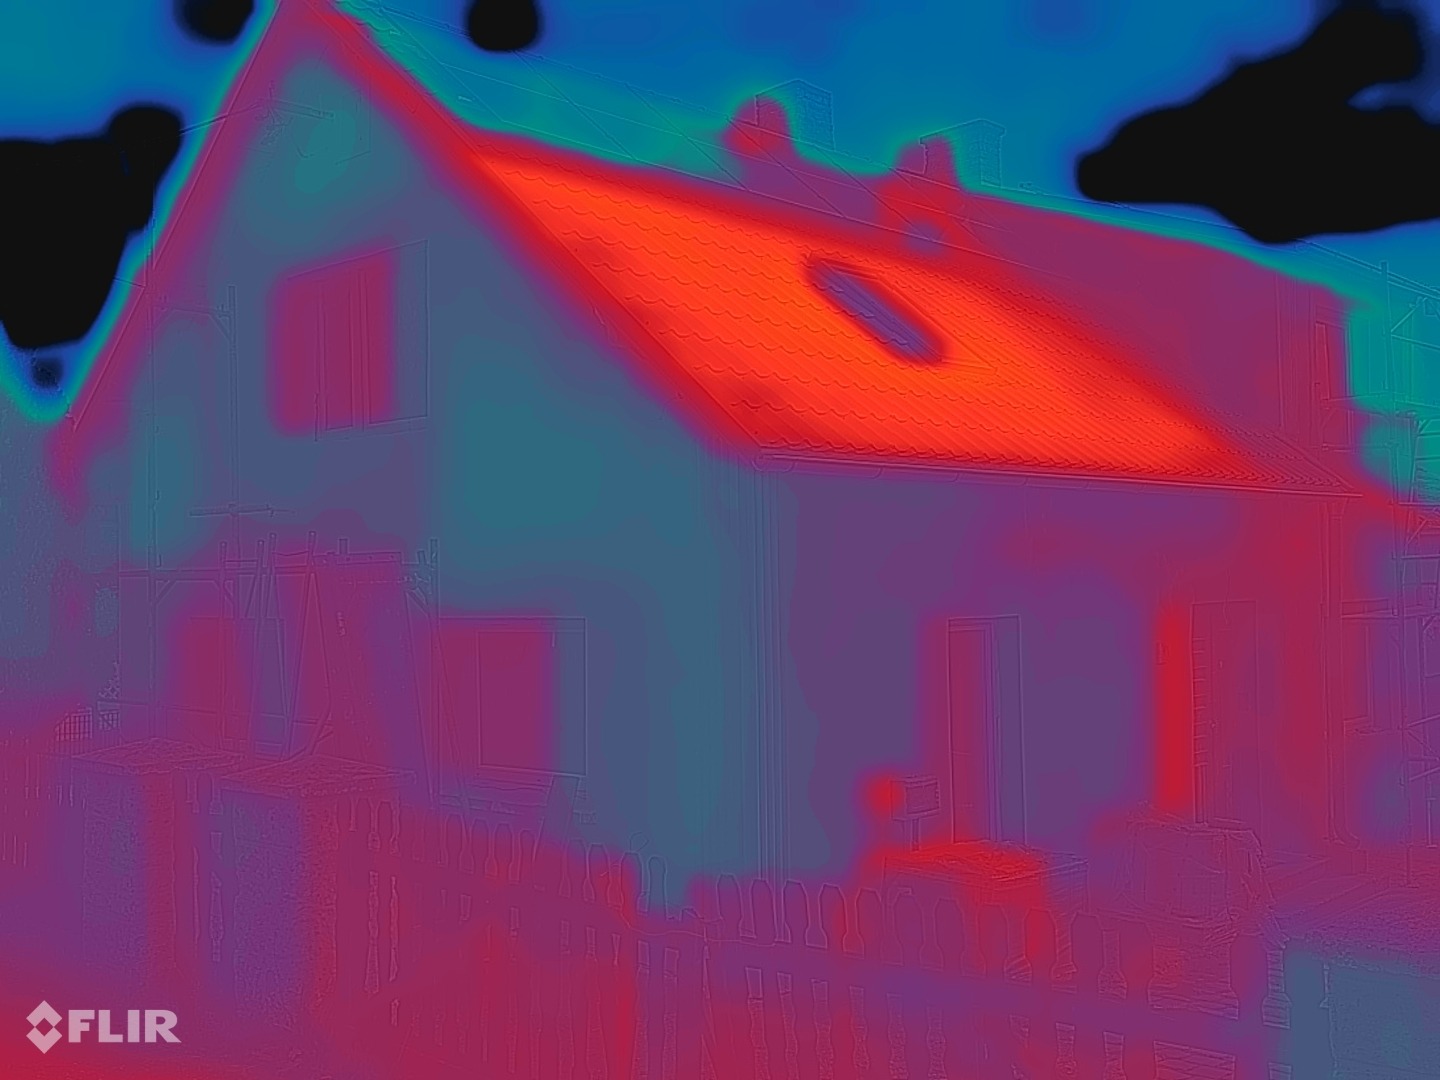
Thermal image of the facade after coating
After

The facade thermally blends into its surroundings

After coating, the facade area that previously stood out clearly is far less pronounced in the thermal image.

Particularly striking: areas not yet coated – such as the dormer and the entrance area – still stand out. The thermal image makes the difference between already-treated and still-untreated surfaces immediately visible.
Cost-effectiveness

Run the numbers for your building

What the effect means for your home is shown by the Energy Calculator: enter your address, and the facade and roof are determined from map and aerial image data, along with costs, savings and payback.

Go to the Energy Calculator

For the applying contractor

Technical data sheetEverything that matters on site.

Application, consumption, limits of use, aftercare and labelling — in the order in which they are needed on site.

Basis All information is taken from our PSC 250 T system manual. Where a declared parameter underlies a value, it is stated below the line. For classification, first aid and disposal, the current safety data sheet also applies.

System
PSC 250 T — primer ECB BASIC B, functional layer BUILD, finish ECO OUTSIDE
Status
System manual version 1.0, June 2026 edition
Container labelling
The batch number and best-before date are stated on the label of the delivered container.
1,2 mmTotal dry film thickness
3Layers in a fixed sequence
max. 120 barAirless spray pressure
5–30 °CTemperature range for air and substrate
below 80 %relative humidity
24 monthsShelf life in unopened container

Block 01 — Application

Sequence, tools and times. All time specifications apply to the climatic conditions given below in block 03; colder or damper conditions extend every drying time.

Instructions in motion

Layer by layer to the finished wall

Substratearound 1.2 mm
1 / 6

Schematic illustration, layer thicknesses not to scale. Application method according to the system manual: airless spraying preferred, alternatively brush or roller with 8 to 14 mm pile length. Times apply at +5 to +30 °C and below 80 % relative humidity.

Application in stages

  1. Check the substrateMoisture below 4 %, concrete below 2.5 %
  2. PrimerECB BASIC B, approx. 0.1 mmthen 2 to 3 hrs
  3. Functional layer, coat 1BUILD, 0.5 mmthen 4 to 8 hrs
  4. Functional layer, coat 2BUILD, 0.5 mmthen 4 to 8 hrs
  5. FinishECO OUTSIDE, 0.1 to 0.2 mmthen 24 hrs curing

Times from the PSC 250 T system manual, valid for +5 to +30 °C and below 80 % relative humidity; colder or more humid conditions extend every time.

Substrate

Load-bearing mineral and porous substrates: concrete, cement, masonry, stone, render, unglazed ceramic, plasterboard, fibre cement, concrete brick, timber and roofing felt — including old existing buildings and even listed facades, as long as they are consistently load-bearing.

Boundary condition: dry, firm and load-bearing, free of loose material, oil, grease, dust, mould, salt and loose old coatings. Procedure: visual and wipe test for chalking, scratch and tap test for hollow areas, and if in doubt a pull-off or cross-cut test on the primer.

Pre-treatment

Remove loose and non-load-bearing old coatings, clean the surface and fill any defects. Measure substrate moisture: below 4%, below 2.5% for concrete.

Procedure: moisture measurement with a suitable meter; if in doubt, wait until the substrate is ready to receive flooring/coating. Boundary condition: repairs must be fully dry before application.

Primer

PSC 250 T ECB BASIC B, ready to use, approx. 0.1 mm. Curing around 24 hours, recoatable after 2 to 3 hours without sanding.

Boundary condition: no thinning is intended; mix the entire container contents thoroughly before use. The primer is essential for the adhesion of all subsequent layers and can be applied directly to corroded but stable surfaces.

Basis: System data PSC 250 T

Application method

Airless spraying is preferred. Alternatively, brush or roller with 8 to 14 mm pile length.

Boundary condition: only these application methods are approved. Other methods alter the layer thickness and therefore the function of the coating.

Airless — nozzle size

To be selected according to the spray equipment manufacturer's specification and the product. The equipment filter must be removed before application.

Constraint: the filter must be removed because the coating contains ceramic vacuum nanospheres — it would hold them back and alter the spray pattern.

Airless — spray pressure

120 bar maximum.

Constraint: maintain an even distance and overlapping passes so the film thickness stays uniform. Higher pressure increases overspray and reduces film thickness.

Number of coats

Three layers in a fixed sequence: primer, functional coat, top coat. The functional coat is applied in two passes.

Constraint: the number of coats follows from the required dry film thickness, not from appearance. Opacity is not a measure of function.

Wet film thickness per coat

Functional coat 0.5 mm per pass. Primer approx. 0.1 mm, top coat 0.1 to 0.2 mm.

Constraint: the two passes of the functional coat together give 1.0 mm. If either pass is applied thinner, the finished build-up will be short of thickness.

Basis: System data PSC 250 T

Total dry film thickness

Approx. 1.2 mm across all three layers: primer approx. 0.1 mm, functional coat 1.0 mm, top coat 0.1 to 0.2 mm.

Constraint: this applies to the complete system build-up. A partial application is not a thinner build-up, but a different one.

Basis: System data PSC 250 T

Intermediate drying

The next coat can be applied as soon as the surface is touch-dry — after approximately 2 hours. For the functional coat, 4 to 8 hours.

Constraint: recoatable without sanding. These figures apply to the climatic conditions given in block 03; colder or damper conditions extend every time given.

Basis: System data PSC 250 T

Through-drying / load-bearing capacity

Curing approx. 24 hours per layer, drying at least 24 hours. Maturing time of the finished build-up 24 hours.

Constraint: the fresh coating must be protected from rain and frost for at least 6 hours.

Basis: System data PSC 250 T
Layer build-up in cross-section, schematicCross-section through the wall build-up. From inside to outside: substrate, primer ECB BASIC B, functional coat BUILD in two passes, and top coat ECO OUTSIDE. The bracket on the left runs from the substrate surface to the outer surface, indicating the dry film thickness of the entire build-up including the primer. The diagram is not to scale and contains no measured values.approx.1.2 mmTotal dry film thicknessTop coat ECO OUTSIDEFunctional coat, pass 2Functional coat, pass 1Primer ECB BASIC BSubstrate / component
Layer build-up in cross-section. The drawing shows the sequence of the layers, not their size ratio — the actual thicknesses are given in the table below. A to-scale drawing of the comparison is on the product page.
Values as a table
Layer sequence and layer thicknesses of the PSC 250 T system build-up
ItemLayerWet film thicknessDry film thicknessBasis
1Substrate / componentn/an/ano measured value
2Primer ECB BASIC Bapprox. 0.1 mmapprox. 0.1 mmSystem data PSC 250 T
3Functional layer BUILD, 1st application0.5 mmcombined 1.0 mmSystem data PSC 250 T
4Functional layer BUILD, 2nd application0.5 mmcombined 1.0 mmSystem data PSC 250 T
5Top coat ECO OUTSIDE0.1 to 0.2 mm0.1 to 0.2 mmSystem data PSC 250 T
—Total coating1.2 to 1.3 mmapprox. 1.2 mmSystem data PSC 250 T

Block 02 — Consumption and coverage

The basis for every calculation. Consumption figures are guide values on a smooth substrate; texture, absorbency and application method alter them considerably.

Material calculator

How many containers do I need?

Functional layer–
Primer–
Finish–

Containers of 18 litres. Guideline values on a smooth substrate from the system manual (functional layer 0.9 l/m², primer 100 to 200 ml/m², finish 0.18 to 0.30 l/m²), with no allowance for waste, overspray and junctions. Actual consumption is only confirmed on a trial area.

Consumption per coat

Primer 100 to 200 ml/m². Functional coat 0.9 l/m² over both passes. Top coat 0.18 to 0.30 l/m² depending on film thickness.

Constraint: guide values on a smooth substrate. Texture, absorbency and application method alter them considerably; consumption becomes binding only once determined on a sample area.

Basis: System data PSC 250 T

Total consumption

Approx. 1.2 to 1.4 l/m² for the complete build-up of primer, functional coat and top coat.

Method: sum of the individual consumption figures from the row above. Constraint: excludes an allowance for cutting waste, overspray and detailing.

Basis: System data PSC 250 T

Coverage

An 18-litre container of functional coat covers approx. 20 m². Primer approx. 90 to 180 m², top coat approx. 60 to 100 m² per container.

Method: container content divided by consumption per square metre. Constraint: site-specific consumption must be determined on a trial area.

Basis: System data PSC 250 T

Container sizes

18 litres. Primer 16.2 kg, functional coat 9.36 kg, top coat 16.2 kg per container.

Constraint: note the batch number for each container; if multiple batches are used on one area, box-mix them beforehand.

Basis: System data PSC 250 T

Block 03 — Application limits

These limits determine adhesion and film formation. If any is not met, the result cannot be remedied by rework — it must be rebuilt from scratch.

Weather window check

Can I paint today?

Cleared

Limits from the PSC 250 T system manual: air and substrate +5 to +30 °C, relative humidity below 80 %. For guidance only; it replaces neither the on-site inspection nor the trial area.

Application temperature, air

+5 °C to +30 °C.

Constraint: below +5 °C no continuous film forms; above +30 °C the surface dries faster than the depth.

Basis: System data PSC 250 T

Substrate temperature

+5 °C to +30 °C. The primer tolerates surface temperatures of up to +45 °C.

Constraint: do not apply to a substrate in direct sunlight above +30 °C, even if the air temperature is within range.

Basis: System data PSC 250 T

Relative humidity

Below 80%.

Constraint: above this, film formation is delayed to the point that the intermediate drying times no longer apply.

Basis: System data PSC 250 T

Dew point margin

Not separately declared. What matters is substrate moisture below 4% (concrete below 2.5%) and relative humidity below 80%.

Constraint: the manual does not list the dew point margin as a separate limit value. Working to the usual 3-kelvin rule keeps within the limits stated above.

Unsuitable substrates

PE, HDPE, PP, PTFE and other plastics. Non-load-bearing or loose existing coatings. Surfaces in direct sunlight above +30 °C.

Constraint: do not apply if rain or frost is expected; protect the fresh coating from either for at least 6 hours.

Basis: System data PSC 250 T
Trial area / advance sample

Test on a site-specific trial area before full application.

Method: sample area on the original substrate, same application method, same number of coats. Constraint: adhesion, appearance and actual consumption are determined on site, not taken from the data sheet.

Basis: Procedural note

Block 04 — Aftercare, storage, disposal

What applies after the final pass: recoating, tools, leftover material and containers.

Overcoatability

Within the system, without sanding: primer after 2 to 3 hours, functional coat after 4 to 8 hours, top coat after 2 to 3 hours. The top coat can be tinted to RAL shades in the COLOR and SPECIAL COLOR versions.

Constraint: third-party coatings over the finished build-up are not approved — they alter emissivity and vapour permeability, and thus function.

Basis: System data PSC 250 T

Cleaning tools

With water, immediately after use.

Constraint: the products are water-dilutable; dried-on material is difficult to remove.

Storage and shelf life

24 months in the unopened original container. Store and transport frost-free at +5 °C to +30 °C, protected from direct sunlight.

Constraint: opened containers should be used promptly; the date on the container applies to unopened goods.

Basis: System data PSC 250 T

Disposal

Send emptied containers for recycling. Liquid residues must not go into the drainage system — take them dried out, or as hazardous waste, to the local recycling centre.

Method: the product-specific waste code under the Waste Catalogue Ordinance is given in Section 13 of the safety data sheet. It applies to the specific product, not generically to all coating materials.

Block 05 — Safety and labelling

This section does not replace a safety data sheet. For classification, first-aid and disposal information, only the current safety data sheet applies.

Safety data sheet

We supply the safety data sheet in accordance with Regulation (EC) No. 1907/2006 (REACH), Annex II, in its current version. It is available on request in advance.

Constraint: the SDS must be available on site before first use and must feed into the risk assessment.

Hazardous substance labelling

Classification and labelling follow the CLP Regulation (EC) No. 1272/2008. Pictograms, the signal word, and H- and P-statements appear on the label of the delivered container and in Section 2 of the safety data sheet.

Constraint: the label of the container actually delivered is always the authoritative source.

Personal protective equipment

Safety glasses, gloves and protective clothing. When spraying and in confined spaces, respiratory protection is additionally required, along with adequate ventilation and extraction of the spray mist.

Constraint: spray application and work in enclosed spaces are subject to different requirements than rolling. Glove material and breakthrough time must be taken from Section 8 of the SDS.

VOC content

9.1 g/l for the functional coat, measured to PN-EN ISO 11890-1. The system value is 10 g/l maximum.

Method: labelling under the German ChemVOCFarbV (implementing Directive 2004/42/EC), stating category, limit value and actual content.

Basis: System data PSC 250 T